

Debugging Vista Sidebar Gadgets in Visual Studio 2008
Posted by Keith Elder | Posted in Vista Gadgets | Posted on 31-01-2008
I’ve recently been digging into writing Sidebar Gadgets for Windows Vista. As a client developer mainly, writing a gadget has brought me back to my Javascript / HTML / DHTML / CSS roots. Over the next several weeks I’ll be writing some entries on my experience writing gadgets but before I get into the gory details let’s talk about debugging. For those of you that are starting out writing gadgets the first thing you are going to run into is how to debug them.
Overriding Alert
Once you get your initial gadget setup (which I’ll cover in a later blog post) you will no doubt run into a JavaScript error along the way. For those familiar with JavaScript, the alert() function is classic favorite to view variables. The alert function allows a developer to pass in something like the following:
alert(“That’s some good code there paw paw!”);
This will print a dialog box with the message. The problem is that within gadgets this function doesn’t work. To circumvent this shortcoming the first thing that must be done is create an override function for alert(). Within the alert function we’ll be writing to System.Debug.outputString(msg) to print the variable we need to debug. As a side note, I suggest creating another variable to turn this on or off so you don’t have to go back through all of your JavaScript and comment this line out.
var debug = true;
function alert(msg)
{
    if (debug)
    {
        System.Debug.outputString(msg);
    }
}
More information on System.Debug can be found here:
http://msdn2.microsoft.com/en-us/library/aa359287(VS.85).aspx
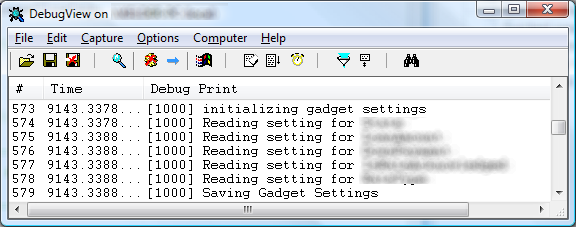
Once the new alert function has been established the messages passed to the new alert() method can be viewed by running DebugView. DebugView is a utility to view low level messages as the gadget is running (as well as other things). For those not familiar with DebugView here is a description taken from the Microsoft site:
DebugView is an application that lets you monitor debug output on your local system, or any computer on the network that you can reach via TCP/IP. It is capable of displaying both kernel-mode and Win32 debug output, so you don’t need a debugger to catch the debug output your applications or device drivers generate, nor do you need to modify your applications or drivers to use non-standard debug output APIs.
Here is an example of debugging a gadget with DebugView:
Setting Up Internet Explorer to Debug
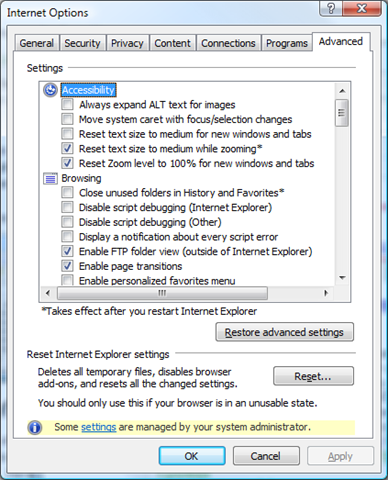
Before we can start to truly debug gadgets a couple of settings need to be adjusted within Internet Explorer. The advanced settings of IE can enable scripting to be debugged and this is important because Sidebar uses the IE engine to render gadgets. Within IE go to Tools->Internet Options and click on the advance tab. Within the browsing section, uncheck the two “Disable script debugging….” options as shown here.
No when a JavaScript error occurs you will get the following screen:
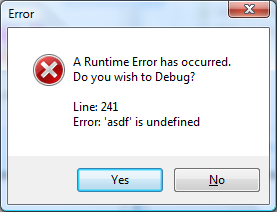
The reason we need to do this is because gadgets are running within the Sidebar executable and if this is disabled error messages will never appear and never give us a chance to debug. When this dialogue appears, clicking yes will then present the Visual Studio Just-in-Time Debugger as shown later on which will then allow you to select a Visual Studio instance to debug with.
Taking Advantage of VS2008’s JavaScript Features
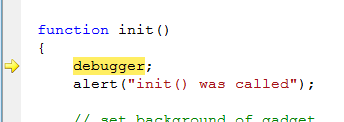
Visual Studio 2008 provides a lot of rich JavaScript support. While it isn’t perfect it is a great start to allow web developers to be able to step through JavaScript code. It is important to note that although VS2008 supports break points for JavaScript within a web solution, sidebar gadgets are not running within the Visual Studio process. Because of this, if you want to debug at a certain point within a gadget you have to add the line debugger where you want to start debugging. Again, setting a break point will do you no good since the gadget is running in another process. Once the line where debugger is hit a screen will pop open from Visual Studio to start debugging. Here’s a sample.
function setup()
{
    // this will start the debugger for VS2008
    debugger;
    alert("init() was called");

    // set background of gadget
    var oBackground = document.getElementById("imgBackground");
    oBackground.src = "url(Images/background.png)";
    alert("background set");

    // do something cool
    saveTheWorldFromPoliticians();
}
Once this line is hit a screen will appear like the following:
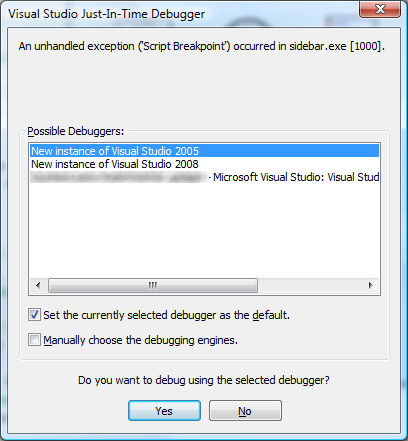
In the example above an instance of Visual Studio is grayed out and is the instance the solution for the gadget is running from. I find it better to use this one than loading a new instance. Selecting it and pressing yes will open the existing solution at the line where the debugger statement is called.
From there it is normal Visual Studio debugging by pressing F10 and or F11. All of the features of debugging such as Quick Watches and break points allows developers to preview variables as was introduced for C# and VB in Visual Studio 2005. Here is a sample of stepping through an init() method and hovering over the oBackground variable:
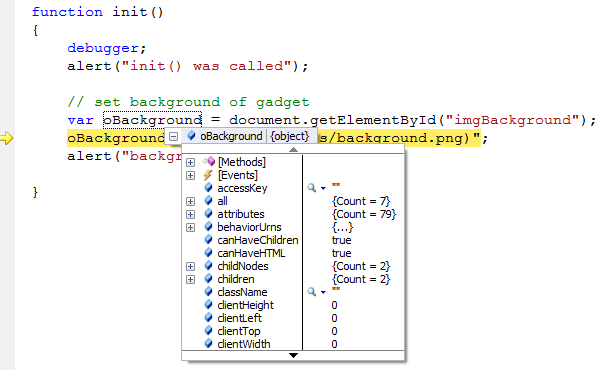
How cool is that?! A full object model is displayed along with supporting methods and events of the object. Very cool no doubt and extremely useful viewing the state of your objects.
Attaching To Sidebar Gadget Instance
If you have a gadget already running within the sidebar you can attach to the sidebar process from within Visual Studio and simply hit a break point within your code. To do this go to the debug menu in VS and then press “Attach to process”. Remember your gadget should already be running within sidebar. In the available processes area select the gadget running within sidebar as shown here:
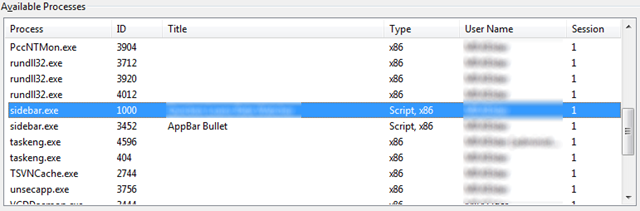
Once attached to the instance of your gadget you can hit breakpoints within your Javascript without the need for the debugger line.
Later on I’ll post some more tips and tricks on building gadgets for Vista but I figured I’d post something on debugging them first since that is literally where I have spent 95% of my time lately.
Hello. I am confused. I have a 3rd party gadget that should work on my windows 7 64bit home premium laptop. The tech for this gadget says that he does not know and that the creators of this gadget from Russia moved on and are not available to fix the gadget. So, I have the gadget, I have Visual Studio 2010 and no skills. I know that there is some kind of error in one of the scripts. I need a step by step plan to find the problem in the gadget and then what to do after that. Can anyone help?
my server pop up Visual studio just-in-time debugger each time it pops up it clashes my website. what can i do to resolve that. My mail address is cuteoly4life@yahoo.com.
I try to debug a windows 7 gadget with visual studio 10 beta. debug mode is running, but there is no javascript source loaded to work with. any idea?
i have created a macro that automaticly attaches to the process of the first gadget on the sidebar 😀
(i have it bind to a key so i can quickly access it)
ps: don’t forget to fill in your computername!
Sub AttachSidebar()
Try
Dim dbg2 As EnvDTE80.Debugger2 = DTE.Debugger
Dim trans As EnvDTE80.Transport = dbg2.Transports.Item(“Default”)
Dim dbgeng(1) As EnvDTE80.Engine
dbgeng(0) = trans.Engines.Item(“Script”)
Dim proc2 As EnvDTE80.Process2
Dim eersteGeweest As Boolean = False
For Each process As EnvDTE.Process In dbg2.GetProcesses(trans, “COMPUTERNAMEGOESHERE”)
If process.Name.Contains(“sidebar.exe”) Then
If Not eersteGeweest Then
eersteGeweest = True
Else
proc2 = process
proc2.Attach2(dbgeng)
End If
End If
Next
Catch ex As System.Exception
MsgBox(ex.Message)
End Try
End Sub
Oops sorry, I was over riding alert() with a sub in a .vbs to call MsgBox, this no longer works. But if I over ride in .js and call a sub containing MsgBox in the .vbs file this does work.
Sorry for the confusion.
I was using the alert() over ride for my Vista gadgets, however it no longer appears to work in the Windows 7 Beta 🙁 Shame as I was using it to flag invalid user input too.
get the “Creating vista gadgets” book from http://innovatewithgadgets.com
they have great a chapter on debugging
Lots of love for this post from a frustrated web developer. 😛
Vista Gadgets are very cool. They're like these mini-apps that can run in your sidebar and provide
All I meant to say is that debugging javascript in this way is not a new feature for 2008. This method also worked in 2005.
As I mentioned in the article John, just adding a break point will not work since the gadget is running in an instance of another executable.
You can hit a break point in VS2008 as you stated but the difference is you have to attach the the specific instance of the gadget with VS and then breakpoints will be hit. However for initialization methods this doesn’t work since there isn’t a previous running instance of the gadget to attach to. This is where the debugger line comes in handy.
Hey Keith, the debugger technique actually works in Visual Studio 2005 as well. Visual Studio 2008 added support for debugging Javascript where you didn’t need to physically change the Javascript file, you could instead just place a normal breakpoint.
The technique you showed does work, and it will actually cause a breakpoint to be hit for Firefox as well, at least I’ve tested this if you’re using Firebug.